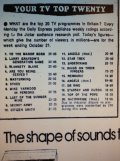
Thanks to being able to access old newspapers for work, I've been looking through for old references to LotSW, saving any articles and references which I may post at some point. But I've also found, in the express, weekly tv charts, which shows just how many people watched the show in the 70s & 80s. The highest viewing figures I've found so far, seem to be Series 5, which was helped by being broadcast opposite a very long ITV strike.
I can't find the chart that would show what Full Steam Ahead got, but for the rest of the series, the ratings were as followed
The Flag and it's Snags - 20.90m
The Flag and Further Snags - 21.90
Deep in the Heart of Yorkshire - 21.65
Earnshaw Strikes Again - 22.20
Here we go into the Wild Blue Yonder - 19.55
Here we go Again into the Wild Blue Yonder - 13.05 (the strike had ended by this time)
So "Earnshaw Strikes Again" had the most viewers with a massive 22.20 million viewers, the chart is shown attached


